
Land Threatened By Flooding
Reaching the GtCO2-eq/yr rate would require 550 to 4,300 km2 of land, depending on the constraints on the injection rate. . For comparison, this is roughly the scale of a county in the U.S. (the size of counties in the U.S. at the 2000 U.S. Census range from less than 1,000 km2 to more than 10,000 km2. The median is 1,610 km2 and the mean size of a county in the U.S. is approximately 2,900 km2). Shallow GCS could be conducted in many locations solely for the purpose of carbon storage, but it will have an important economic co-benefit in areas where the increase in elevation would reduce the risks of flood damage to facilities of high value. In some locations, the value of flood protection may be sufficient to pay for the Shallow GCS process entirely, with carbon storage occurring at zero net cost.
We considered a facility to be of high value based on factors such as its worth, contribution to the economy or national security. This resulted in a long list of facilities and associated land, and we selected ones for which assessments were available. Data are summarized in section S4.4 in Supplementary material.
The analysis indicates areas of high value coastal facilities and associated land at risk of flooding ranges from 1,400 to 6,000 km2 (Table S1). The range of areas increases significantly to between 4,500 and 18,000 km2 when inland houses at risk of flooding are considered.
The analysis outlined above concluded 550 to 4,300 km2 of land would be needed to store 1 GtCO2eq/yr. The results summarized in Table S2 and detailed in S4.4 in the Supplementary material indicate that meeting the 1 GtCO2eq/yr goal would not be limited by availability of high value land threatened by flooding. Important benefits could be obtained by raising agricultural land, coastal wetlands, and other land-use types that were not included in assessment, so the data in Table S2 are a lower estimate of the land area that could benefit.
The areas of high-value infrastructure that are estimated to be threatened by flooding were assess from published sources. The estimates were made using conservative bases when possible. For example, the areas used for storm surge were based on Category 1 or 2 storms, even though larger areas from Category 4 or 5 storms were available. We used area estimates from intermediate levels of predicted sea level rise when estimates using predicted high levels were larger.
The area estimates are bracketed between a low and high value (where the low estimates are either taken from scaled present day data, or from predications to 2030 or 2050). The high bounds are in some cases from present day data, but most are based on predicted to 2100.
Sea-level rise increases the risk of loss of function at ports (Izaguirre et al., 2021), which can have significant economic implications, and raising elevation has been evaluated as a measure of countering this risk (Becker et al., 2017). The approach considered by (Becker et al., 2017) was to raise elevations by dismantling infrastructure, bring in fill and rebuilding. One hundred major U.S. ports cover approximately 380 km2 and the cost to raise them by 1 m ranges from $123 to $175/m2, according to (Becker et al., 2017). Adding another meter of elevation costs an additional $25/m2. More than 800 of the 2000 ports worldwide will face at least moderate risks due to sea level rise by 2100 in the RCP8.5 scenario, according to Izaguirre et al., (2021).
Airports in coastal areas are commonly built near sea level. Thirteen major airports in the U.S. are already vulnerable to flooding (Griggs, 2020; Schwartz et al., 2014), and several more will be at risk in the future (Yesudian & Dawson, 2021). The surface areas of the 13 major U.S. airports recognized as currently vulnerable to flooding (Schwartz et al., 2014) is approximately 89 km2 (Table S3). More than 100 airports worldwide will be below sea level and more than 1000 will be in near sea level in 2100, with specific numbers depending on the sea level rise scenario (Yesudian & Dawson, 2021)
Flooding of roads has significant economic impact by causing traffic delays of people and goods, and increased maintenance requirements. Approximately 12000 km of roads are vulnerable to nuisance flooding from high tides in the eastern U.S. (Jacobs et al., 2018a) and 19200 km are vulnerable in the continental U.S. (Fant et al., 2021). A greater length, approximately 96000 km of roads are vulnerable to flooding according to (Jacobs et al., 2018b). Using 12m for the minimum width of a two-lane road with shoulders gives areas of roads currently vulnerable to flooding of 146, 234, and 1171 km2 for the three scenarios.
Houses
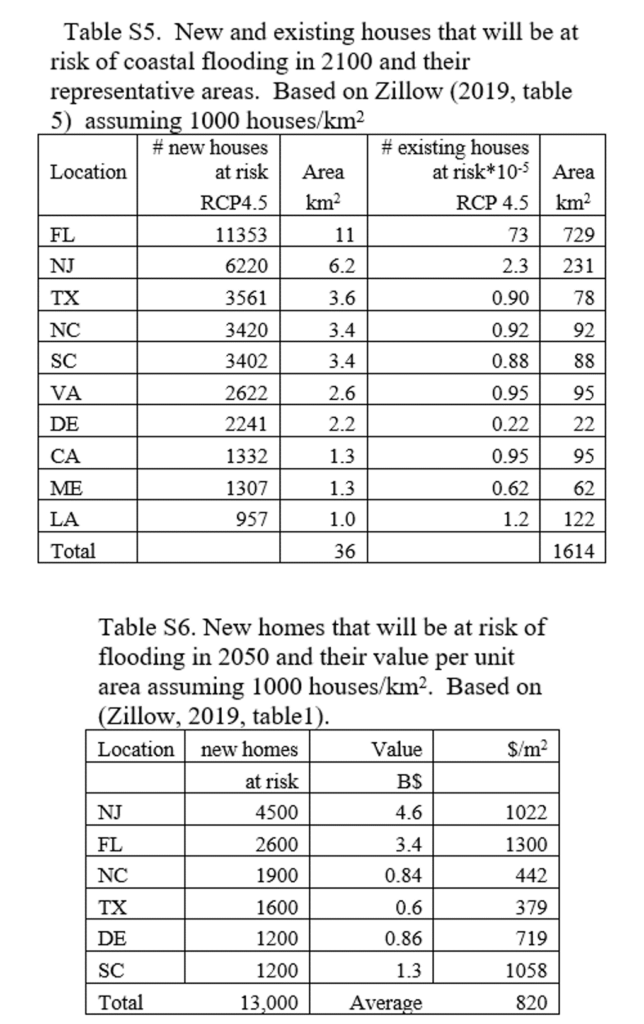
Many thousands of houses and businesses in small dwellings along the coast are at risk of damage by flooding, but the risk also extends inland to houses built in floodplains or other low-lying areas, according to (First Street Foundation, 2020; Union Concerned Scientists, 2018; Zillow, 2019). The risks increase with sea level rise and the numbers of houses identified as at risk depend on the extent of sea-level rise and the classification of the houses.
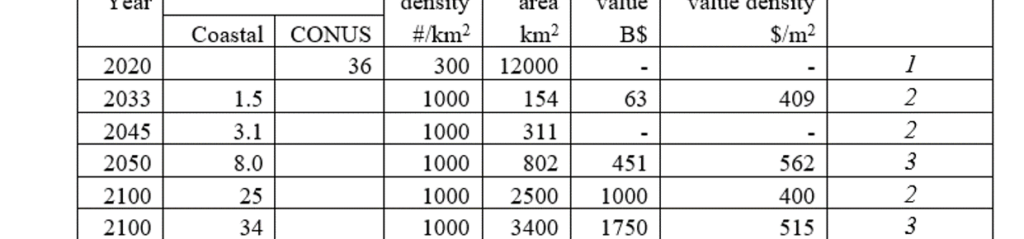
The area underlying coastal housing property that will be threatened by flooding in 2033 is approximately 150 km2, and it increases to more than 2000 km by 2100, assuming a density of 1000 houses/km2 (approximately ¼ acre/house). The value density of these properties in in the range of $400 to $500/m2 .
There are at least 1500 km2 of housing property threatened by flooding in 2100 based on RCP4.5. Most of this area consists of older houses, but new houses (built since 2010) will also be threatened. Approximately 13 km2 of property underlying new houses will be threatened by 2050, and they are valued at $850/m2.
Most of areas we considered as threatened by flooding caused by sea level rise are on the coast, but large areas and many houses are threatened by flooding in the continental U.S. (First Street Foundation, 2020). The vulnerability of these areas could be reduced by raising their elevation, so we included them in the dataset.
Military bases and NASA facilities in coastal areas will be affected by increases in nuisance flooding from tides and episodic storm surge. The most vulnerable areas are affected by tidal flooding, which is mild in depth but occurs daily to monthly and can have significant impact on infrastructure. The flooding risk to military bases was evaluated by creating maps of the areas inundated by storm surges and tidal flooding with levels of sea level rise corresponding to intermediate and highest predicted sea level rise (Dahl et al., 2016). The results for the effects of tidal flooding are presented as plots of the areas affected in 2050 and 2100 for the two scenarios by Dahl et al. (2016). We used the minimum percent change in 2050 and the maximum percent change in 2100 to bound the predicted change due to tidal flooding. (Dahl et al. (2016) also presents the number of days when the base is affected by tidal flooding, and there are significant increases at all the sites. We are interested in the area affected, not the duration of the effect, so those data are not included here, but they underscore the severity of the future problems of tidal flooding.
Data on the area affected by tidal flooding are not presented by (Dahl et al., 2016) for some bases, but in most of these cases data on the area affected by storm surge is given. We used the area affected either now or in 2050 due to a Category 1 storm as the minimum and the area affected in 2100 due to a Category 1 storm as the upper limit in most cases. The exception was at Elgin AFB where the area affected by a Category 2 storm is used because the other data are not given.
Data extracted from (Dahl et al., 2016)for individual military bases are outlined below. A low and high estimate is given at each location as a ratio of the area affected by flooding to the total area of the base. The extent of tidal flooding and the Category 1 (or Category 2 at Elgin AFB) storm surge will be smaller than the areas inundated by Category 3-5 storms. As a result, the maximum areas affected at each site are conservative.
The average ratio of the area affected by flooding ranges from 0.14 to 0.54 using the data given below.
NAS Key West
5800 acres. Areas inundated by tides ranges from 0.3 to 0.95 between 2050 and 2100.
Elgin AFB
463,360 acres. Area affected by category 2 surge today: 11400 acres. Area affected by category 2 surge in 2100 assuming intermediate sea level rise: 17,000 acres
NAS Mayport
3409 acres. Daily flooding from tides 0.2 to 0.55.
NSB Kings Bay
18058 acres 0.20 of area exposed to flooding with 5 ft of surge today from Category 1 storm. Increases to 50 percent by 2100 in intermediate sea level rise scenario.
Hunter Army Air Field
5496 acres. 0.25 of area exposed to flooding in Category 1 surge, 0.3 in 2100 with intermediate sea level rise scenario
MCRD Parris Island
5615 acres. 0.45 to 0.75 of area affected by tidal flooding, according to figure.
MCAS Beaufort
7808 acres. 0.45 affected by Category 1 surge in 2100. Areas affected at earlier time not given.
NAS Dam Neck
1100 acres. 0.1 to 0.75 land loss from tidal flooding according to figure.
Naval Station Norfolk
3798 acres. 0.11 exposed to Category 1 surge now, 0.78 exposed by 2100 with intermediate sea level rise. Tidal flooding would also be a factor with 0.2 area flooded daily by 2100 with the highest sea level rise scenario.
Langley AFB
463,360 acres. 0.1 to 0.8 land loss from daily tides, according to figure.
Fort Eustis
7940 acres. 0.6 land loss from high tides in 2100.
NSF Anacostia
956 acres. 0.1 to 0.5 land loss from daily tides, according to figure.
Washington Navy Yard
96 acres. 0.1 to 0.45 inundated in 2100 to Category 1 with intermediate sea level rise
US Naval Academy
338 acres. 0.02 to 0.4 land loss from tides.
UCS Sandy Hook
220 acres. 0.02 to 0.6 land loss from tides
Portsmouth NS
281 acres. 0.02 to 0.25 land loss from tides
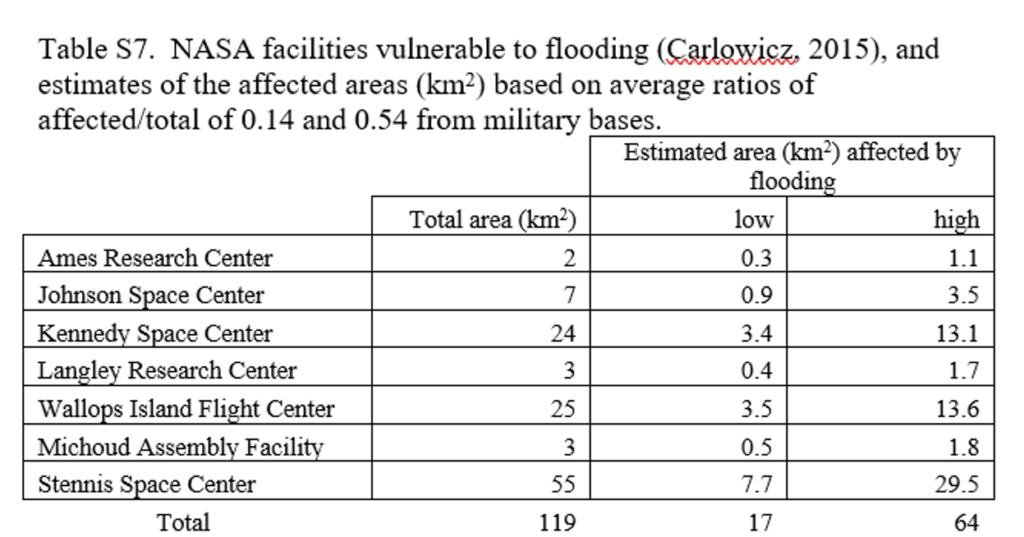
Coastal areas are ideal for launching rockets, and many NASA launch facilities are threatened by flooding because they are located near the coast. Facilities facing increased flood risks were identified by Carlowicz, (2015). The extents of the land areas of each facility that would be threatened by a certain sea level rise are unavailable. These areas were estimated using the average ratio of the affected area to the total area from the data for military bases (Table S7). These ratios are 0.14 for the low estimate and 0.54 for the high estimate.
The productivity of agricultural areas is reduced by flooding and saltwater inundation (Gopalakrishnan et al., 2019; Gould et al., 2020; Shirzaei et al., 2021). The value of agricultural land is less than the other land use categories described above, so we did not include the area of affected agricultural land in our estimates of high-value land vulnerable to flooding (Table S2. High and low estimates of the areas associated with high-value facilities that are vulnerable to flood risk now, or that are projected to be vulnerable in the future. Data sources and methods are summarized in supplemental material.). Nevertheless, lost agricultural productivity affects food security (Chen & Zong, 1999; Parvez et al., 2022), so limiting this effect can have important benefits. Most agricultural land lacks infrastructure that could be affected by large displacement gradients, and it is not restricted by space or traffic that can cause logistical problems in developed areas. As a result, applications of Carbon SIRGE to raise agricultural land will be a good opportunity to generate co-benefits while perfecting operational methods designed for applications on high-value land.