The field experiment demonstrated a rate of more than 1.5 mm/day. Lifting ground by 1.5 mm/day would result in 0.5 m in one year and 5 m of uplift in one decade. An increase of 0.5 m of elevation can significantly reduce the effects of nuisance flooding, and 5 m puts land at or above the elevation created by the Galveston grade-raising, which has protected Galveston from severe storm surges for more than a century13.
Restoring wetlands
Even modest intrusion of sea water can have severe effects on plants adapted to fresh water 54. This can damage crops and affect food security 55–57, and it can limit the ability of coastal ecosystems to buffer storm surges when wetlands are damaged by sea water58. Raising ground elevations can limit sea water intrusion, or it can be integrated into the process of restoring coastal wetlands that have already been impacted. Applications to protect agricultural land or wetlands could tolerate greater displacement gradients than applications beneath infrastructure.
Evidence for maximum uplift
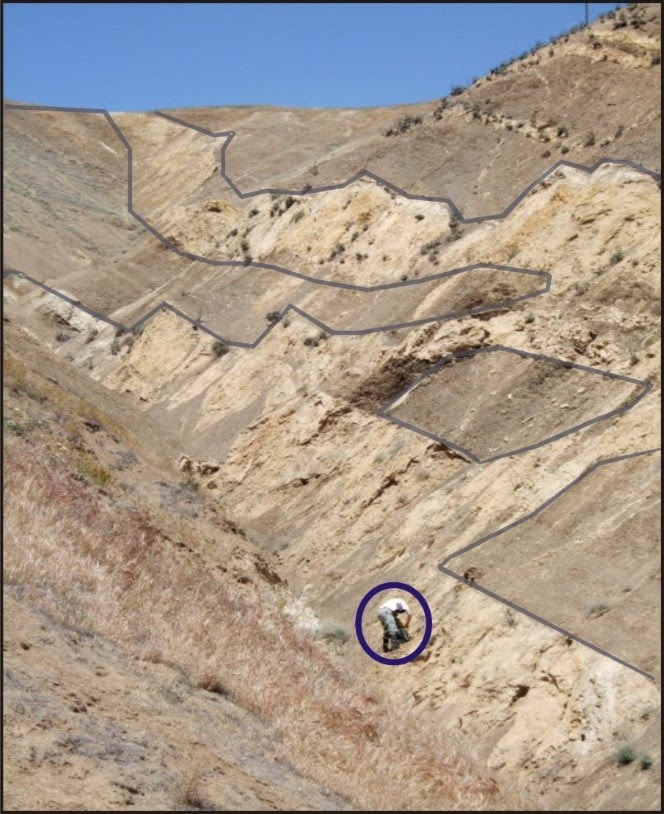
The maximum thickness of a layer of injected material would define an upper limit on the storage capacity per unit area. We think it could be feasible to create layers many meters thick, although to our knowledge the maximum thickness of an injected layer achieved by an engineering project is one to several tenths of a meter13. Nevertheless, there is significant evidence from the geologic record that much thicker layers can be injected at depths of 100s of meters13,59,60. Layers of sand called “injectites” up to several 10s of m thick and 1 km or more in lateral dimension (an injectite is shown in cross-section in figure 6 in 13) are known from outcrops and seismic data, and geologic evidence indicates they were created by injection. Injectites are inferred to form by mechanisms similar to hydraulic fracturing, which is why we think the storage capacity of Shallow GCS (Carbon SIRGE) could be several meters. The extent to which engineering methods can match the thickness of injectites will need to be established with further investigation.
Two sand-filled layers injected by natural geologic processes into sediments in west-central California. This type of layer is called an “injectite.” A person is circled for scale. The total displacement caused by sand injection is on the order of 10m. Photo taken by Cecilie Dybbroe Tang. Photo is from Germanovich and Murdoch (2010).
Effects of displacement gradients on infrastructure
Raising the ground to provide flood protection will be particularly useful when existing infrastructure is unaffected by the uplift process. This would require that displacement gradients during uplift are less than a threshold that could damage infrastructure. The mechanical model calibrated from the field experiment shows that displacement gradients can be reduced by increasing the depth of injection from 2.4 to 7.5 m (Figure S9). The displacement field could be smoothed even more by further increasing the depth of injection or adjusting the schedule of injection into each casing. For example, uplift gradients could be reduced by scaling back injection in regions where the uplift is greater or increasing it where the uplift is less than the average (e.g. Section 4.5). A variety of sensors are available to measure strain, displacement or tilt at resolutions that are many orders of magnitude greater than the threshold that would damage infrastructure52. Data from these high-resolution sensors could be analyzed to characterize the displacement field long before problems occurred. These data could then be assimilated using probabilistic optimization techniques that account for uncertainties 53 to guide decisions about creating an injection schedule that minimizes displacement gradients and safeguards infrastructure.
Uplift over a deeper application
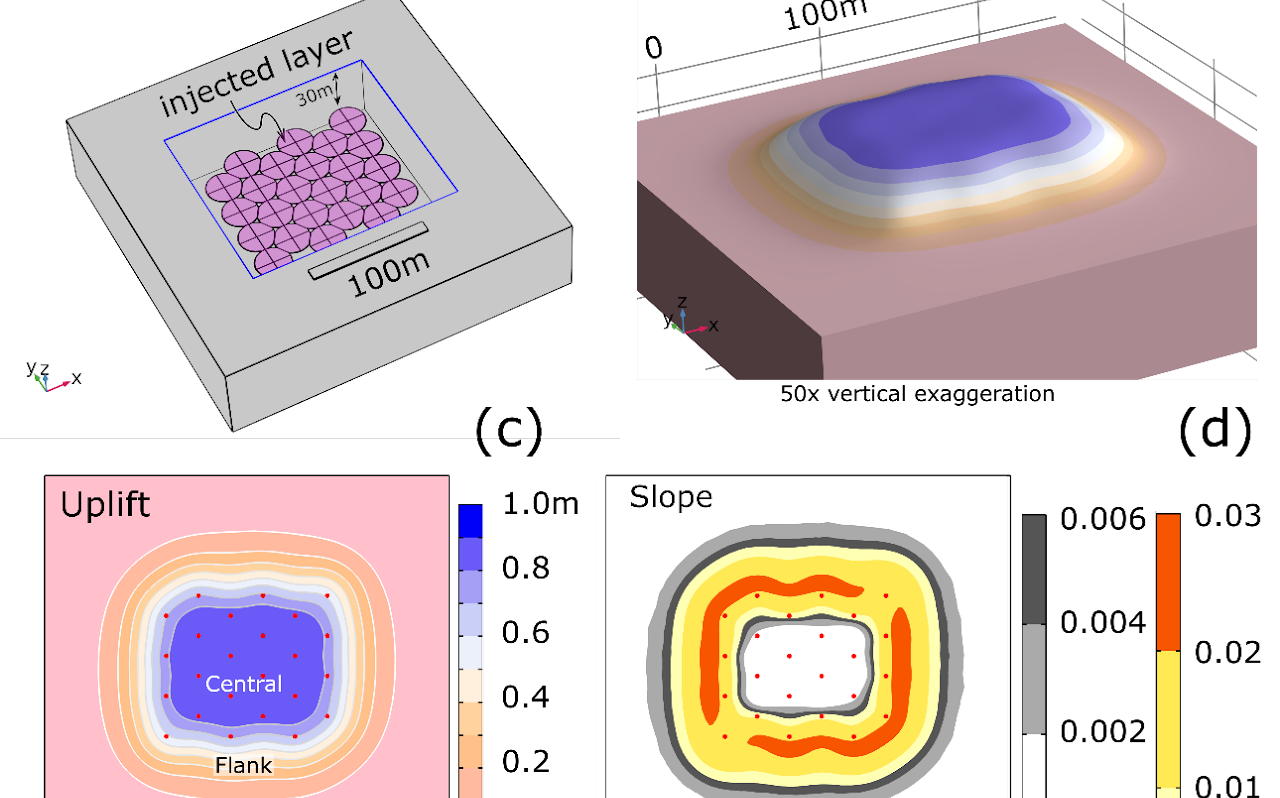
A 4×6 array of injection locations was simulated using the model developed for the field tests to evaluate the displacements in a hypothetical, field-scale project. In this example, we assumed the injection locations were separated by approximately 30m in a hexagonal array and injection occurred at 30m depth (Figure 6). The volume injected into each location was adjusted to achieve approximately 1 m of uplift and to minimize the slope of the ground surface. The results indicate that uplift is characterized by a central region and a flank. The central region contains 8 to 10 borings and covers an area roughly 100 m x 60 m and is characterized by uplift between 0.9 m and 1 m and slopes of less than 0.002. The flank includes the outermost injection borings and some of the borings adjacent to the outer ones. The maximum slope in the flank is between 0.02 and 0.03 (Figure 6).
The array in Figure 6 could be expanded to cover a larger area. This would increase the size of the central region where the slopes are small, while the width of the flank could be similar to the example.
Many houses are less than 30m in maximum dimension and many roads are narrower than 30 m, so they could be accommodated within an array of this scale. Many houses and roads would be unaffected by displacement gradients of less than 0.002. These results show the basic approach that could be used to design an injection project that would create beneficial uplift while minimizing displacement gradients that could affect built structures. Implementation of a project could also include real-time monitoring and feedback to adjust the injection design, as outlined in section 4.4.
Figure 6. Simulated displacement and slope within a scalable design element comprising a 4x6 array of injection locations to give approximately 1 m of relatively uniform uplift and 16,000 m3 of displacement. Simulations were done with the model described in Section 2.3. (a) perspective of 24 injected layers at 30m depth. (b) perspective of ground surface with 50x vertical exaggeration, color scale as in (c). (c) map of vertical displacement (uplift) showing a central zone with relatively uniform uplift and a sloping flank. (d) map of displacement gradient (slope).